You changed the button color on your product page. Then you rewrote the headline. Then you moved the reviews up. None of these felt wrong — but you also have no idea which one actually moved conversions, or whether anything did.
That’s the problem with making store changes without a testing structure. Everything feels like progress, but there’s no clear signal of what’s working.
The conversion rate shifted slightly after one of those changes. But was it the change? Or the traffic source that week? Or the email campaign you sent? Or the fact that it was mid-month and buyers were in a different mindset?
Shopify A/B testing is one of the few ways to make store decisions based on real visitor behavior instead of assumptions. This guide covers everything you need to run tests correctly — what to test, how to set it up, and how to read results without being misled by them.
What Shopify A/B Testing Actually Does (And Why It’s Not Just for Big Stores)
Most merchants think of A/B testing as something big stores with dedicated data teams run. In practice, it’s the most direct way to stop guessing which version of your store performs better and start knowing.
Here’s what it does: it splits your traffic between two versions of a page or element — the original (the control) and a variation — and tracks which one produces more of the outcome you’re measuring. Conversion rate, add-to-cart rate, revenue per visitor, checkout completion — whichever metric connects most directly to the question you’re asking.
Unlike standard analytics, which shows you what’s happening, A/B testing tells you what works. Analytics can tell you that 65% of visitors leave your product page without adding to the cart. A/B testing can tell you whether a specific change to that page reduced that number — and by how much.
What it doesn’t do: replace thinking. A test built on a weak hypothesis will produce data, but the data won’t mean anything. The tool is only as useful as the question it’s answering.
The core principle: stop changing your store based on how something looks to you. Start changing it based on how it performs for your buyers. If you’re unsure where your biggest conversion gaps are, our Shopify Conversion Rate Optimization services can help you find them before you run a single test.
Before You Run a Single Test, Check This First
The most common reason Shopify A/B test results mislead merchants isn’t the tool or the hypothesis — it’s that the store didn’t have enough traffic to reach a reliable conclusion.
The traffic threshold
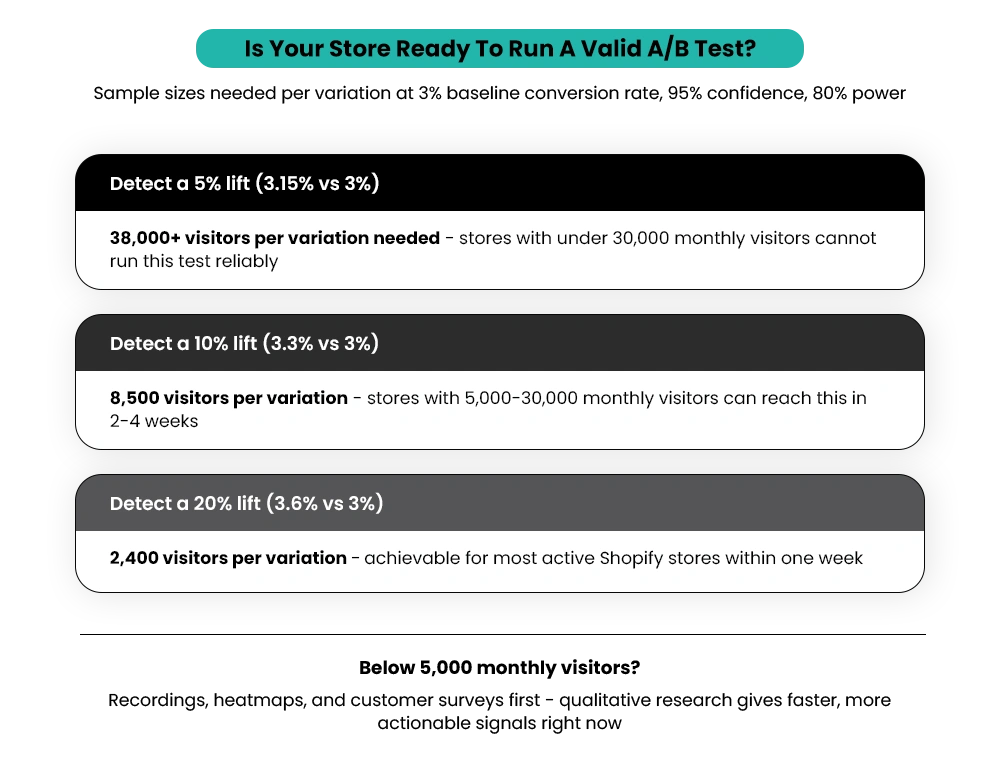
To detect a 10% improvement over a 3% baseline conversion rate, you need roughly 8,500 visitors per variation. To detect a 5% improvement at the same baseline, that number jumps to over 38,000 visitors per variation, based on standard statistical power calculations. If your store can’t reach those numbers within two to four weeks, the test won’t produce trustworthy data.
Stores with fewer than 30,000 monthly visitors should treat A/B testing as aspirational for most page-level tests. Below 5,000 monthly visitors, qualitative research — session recordings, heatmaps, customer surveys — will give you more actionable information faster. Read our guide on how to increase Shopify sales when your store gets traffic but no conversions, if you’re at this stage.
The timing issue
Running a test during a flash sale, a major email campaign, or a promotional period will skew results. Visitor behavior during discounts is fundamentally different from normal purchase behavior. Start tests during stable, representative traffic periods.
The duration rule
Run tests for a minimum of seven to 14 days — ideally across two full business cycles. Ending a test early because one version looks like it’s winning after a few days is one of the fastest ways to make the wrong decision. Conversion patterns vary across the week, and early sample data is almost always misleading.
How to Build a Shopify A/B Test That Actually Means Something?
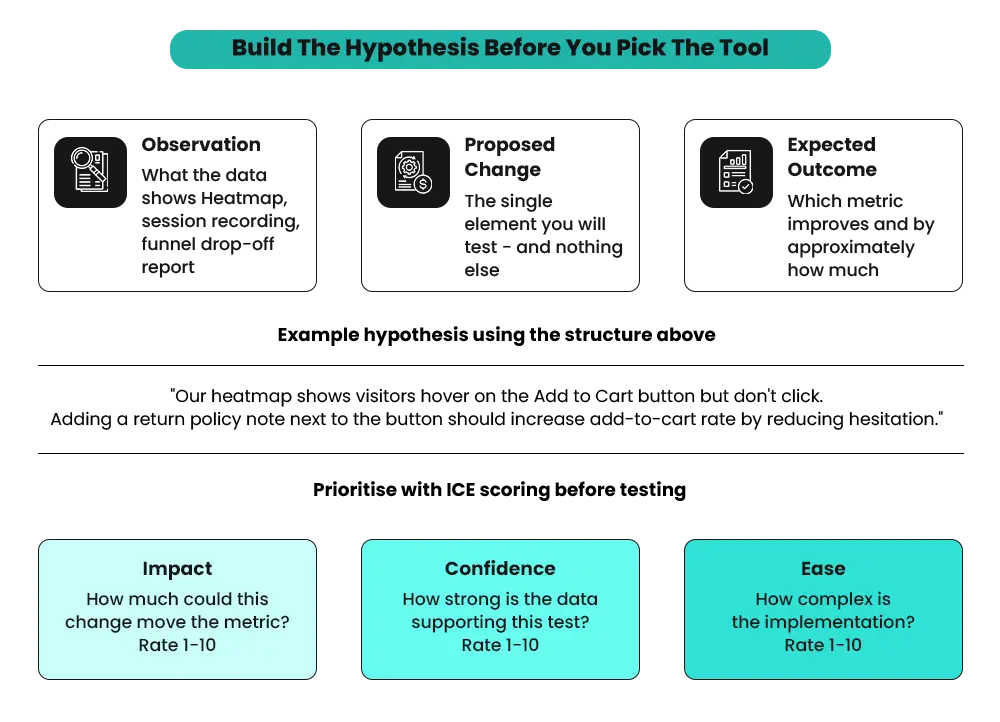
Every test needs a hypothesis before it needs a tool. A hypothesis isn’t “let’s see if a red button does better than a blue one.” A hypothesis is built on observed data: “Our heatmap shows visitors hover on the Add to Cart button for several seconds without clicking. We believe adding a return policy note next to the button will increase the add-to-cart rate by reducing purchase hesitation.”
The structure: observation (what the data shows) + proposed change (what you’ll test) + expected outcome (what metric should improve and by roughly how much).
Without this structure, you can run tests indefinitely and still not build any real knowledge about your store.
How to Prioritize What to Test First?
Use ICE scoring — Impact, Confidence, Ease — to rank your test ideas:
- Impact: How much could this move the metric?
- Confidence: How much data supports that this change is worth testing?
- Ease: How complex is the implementation?
High-traffic pages with visible drop-off problems deserve to be tested first. A product page where 60% of visitors leave without adding to cart is a higher testing priority than a homepage that most buyers bypass after their first visit. Knowing what a good conversion rate for a Shopify store actually looks like in 2026 gives you a meaningful benchmark before you start setting test targets.
A few rules worth keeping:
Don’t test things that are clearly broken (a checkout step throwing an error, a broken image on mobile) — fix them. Don’t test things that are clearly working (a hero image driving strong click-through from paid ads) — leave them. Test the uncertain middle ground: pages where visitor behavior doesn’t match what you’d expect, and where getting the answer right would meaningfully change what you do next.
Which A/B Testing Tools Work Well on Shopify?
Choosing the right tool depends on what you’re testing and your store’s technical setup.
Shopify-Native Options
Shoplift is built specifically for Shopify and runs inside the Shopify admin without additional code snippets. It supports theme-level testing, which makes it accessible for stores without dedicated developer support. If you want to start testing without a heavy technical setup, Shoplift is the most practical starting point for most merchants.
Intelligems focuses on price testing and shipping fee variations — useful for stores where pricing structure hasn’t been validated and could meaningfully affect conversion rate or average order value.
Third-Party Tools That Integrate Well
VWO (Visual Website Optimizer) offers a visual editor, heatmaps, session recordings, and revenue tracking in one platform. It has a clean Shopify integration and is one of the most widely used tools for Shopify CRO work at scale.
Convert.com is GDPR and CCPA compliant, with strong Shopify integration and reliable revenue tracking. A good choice for stores with international audiences or privacy-sensitive traffic.
AB Tasty has a user-friendly visual editor with personalization capabilities — suitable for stores moving beyond basic testing into a broader optimization program.
Wisepops is best used for testing pop-up campaigns, lead capture flows, and on-site promotional offers rather than product page or layout changes.
The right tool depends on what you’re testing. Page-level changes belong in VWO or Shoplift. Pricing and fee variations belong in Intelligems. Popup and lead capture testing fit Wisepops better than a general-purpose testing tool.
What to A/B Test on Shopify — Mapped to Real Conversion Problems?
Not everything in your store is worth testing. The most reliable tests start with a specific conversion problem — something data shows is causing visitors to drop off or hesitate — and test a specific change designed to address it.
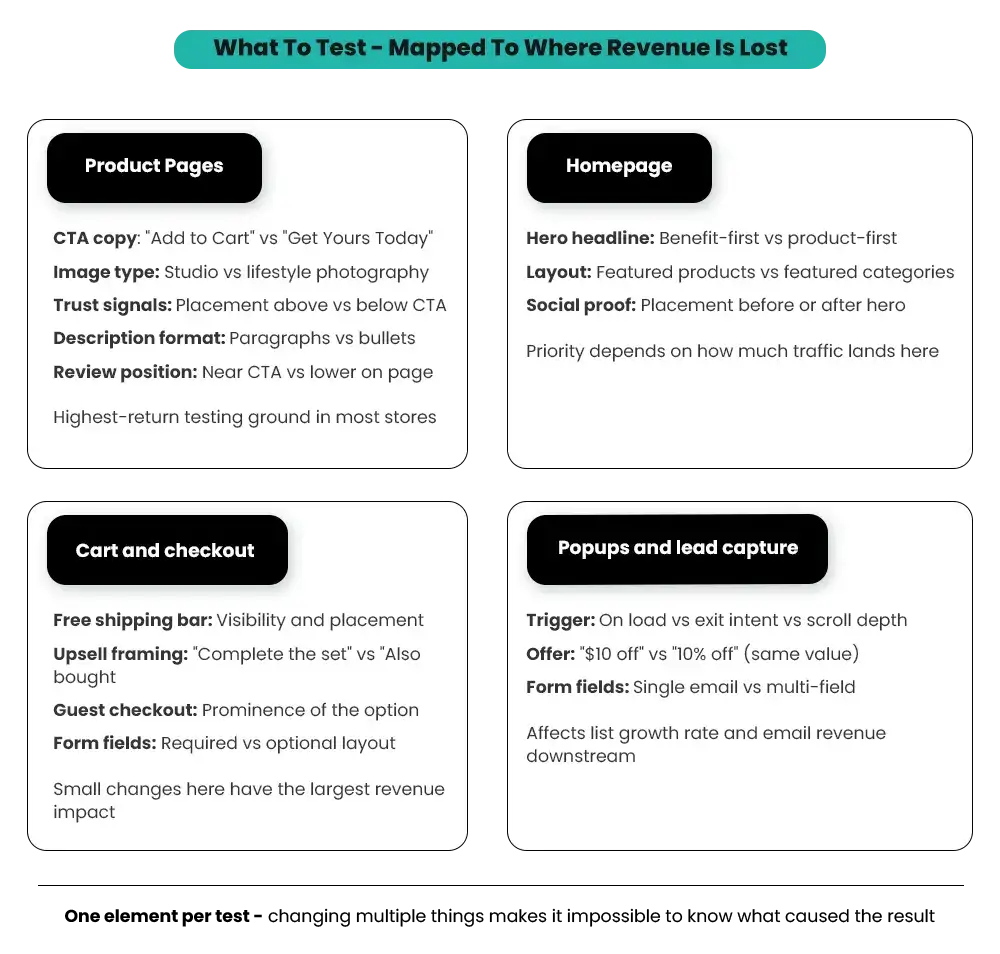
Product Pages
Product pages are where most Shopify conversion decisions happen, which makes them the highest-return testing ground for most stores. According to BrillMark’s 2025 CRO Report, 38% of all A/B tests occur on product detail pages — and they deliver the highest average conversion lifts, between 12% and 28%, when changes reach statistical significance.
CTA button copy and placement. “Add to Cart” vs. “Buy Now” vs. “Get Yours Today” can produce measurable differences. Stores that switch from generic button copy to benefit-driven language see add-to-cart rate lifts of 5–15% on average, according to Evinent’s ecommerce A/B testing research. The framing matters: urgency-based copy works differently from convenience-based copy, and the right choice depends on your product category.
Main product image format. Studio photography on a white background versus lifestyle photography showing the product in use. For fashion and home goods, lifestyle images tend to outperform. For electronics, tools, and technical products, technical clarity usually wins. The hypothesis worth testing is which format your specific audience responds to — that answer isn’t always the category default.
Trust indicators near the CTA. Return policy notes, payment security badges, and shipping time estimates are placed above versus below the Add to Cart button. BrillMark’s 2025 CRO Report found that trust signal placement improves new customer conversion by 11–19%. Placement matters — test whether the element needs to be visible before the button click or whether it’s more effective as reassurance during the checkout flow.
Product description format. Paragraph copy versus scannable bullet points. For high-consideration products where buyers need information to feel confident, detailed copy often reduces pre-purchase hesitation. For lower-priced impulse items, bullets that communicate the key points quickly tend to perform better.
Review position. Above the fold, near the CTA, versus in a lower section of the page. The Baymard Institute’s ecommerce UX research has consistently found that visible star ratings near the top of a product page lift conversion when accompanied by verified reviews — particularly for products with strong review counts. For a broader look at how reviews drive purchases, see our guide on how to use customer reviews in your marketing and sales content.
Homepage
Hero banner headline and CTA. Test the primary message frame: benefit-first (“Free next-day delivery on all orders”) versus product-first (“New Season Collection”). The right answer depends heavily on where your traffic comes from. Cold paid social audiences respond differently from brand-search visitors.
Featured products versus featured categories. For wide catalogs, category navigation on the homepage reduces friction by helping visitors orient. For stores with one or two hero products, featuring those directly can increase add-to-cart rates from the homepage.
Social proof placement. Press mentions, customer review counts, and brand story elements. Test where these appear relative to the first visible product or CTA. According to Evinent’s CRO research, brands that lead with social proof rather than features have seen 11–14% higher conversions.
Before moving to checkout experiments, here’s an example of how careful testing can surface opportunities most merchants overlook:
Cart and Checkout
Cart and checkout carry the highest purchase intent of any page in the funnel — which means small friction points here have an outsized effect on revenue. The Baymard Institute’s cart abandonment research puts the global average cart abandonment rate at around 70%.
Checkout-flow improvements deliver 8–25% gains in completion rates when the right variables are addressed.
Free shipping threshold visibility. How and where the free shipping progress bar or message appears in the cart. Stores that surface this clearly (“Add $12 more for free shipping”) consistently see average order value increase alongside conversion rate.
Upsell placement and framing. Before or after the product list in the cart, and whether the offer is product-based or discount-based. Test the framing: “Complete the set” versus “Customers also bought.” An upsell that feels like a recommendation converts. One that feels like an ad doesn’t.
Guest checkout prominence. For first-time visitors, how visible the guest checkout option is relative to account creation. This is one of the highest-impact variables in the entire checkout flow. Our Shopify Performance Optimization guide covers additional friction points in the checkout experience worth addressing before or alongside your A/B tests.
Popups and Lead Capture
Trigger timing. On page load versus exit intent versus after a set scroll depth. Exit-intent popups generally perform better for return visitors. On-load offers with strong discounts work for first-time visitors arriving from paid channels.
Offer framing. “$10 off your first order” versus “10% off” — even when the math favors the percentage, the absolute dollar amount often converts better for orders below $100. It feels more concrete.
Number of form fields. A single email field consistently outperforms multi-field signup forms. Test whether adding a name field meaningfully improves downstream email performance before making that tradeoff.
Getting Traffic but Not Sure What's Actually Improving Conversions?
A/B testing only works when you know what to test and how to act on the results. Mastroke helps Shopify merchants identify conversion bottlenecks, run data-driven experiments, and improve product pages, carts, and checkout experiences to increase revenue.
How to Set Up and Run a Shopify A/B Test Without Compromising the Data?
Traffic split: Default to 50/50. Only adjust the split if the variant carries real risk — in that case, a 20/80 split limits exposure to the variant while it stabilizes.
Set your primary metric before launching. The metric you’re measuring success by needs to be defined before traffic starts flowing. Adding goals mid-test or switching metrics based on early results invalidates the data.
Anti-flicker setup. Most A/B testing tools insert a JavaScript snippet that can cause a brief flash of the original page before showing the variant. This creates a poor experience and skews results. Verify the anti-flicker snippet is implemented correctly before running live traffic — this often requires developer input for custom Shopify themes.
What to avoid once the test is running:
- Don’t make other changes to the page during the test. New app installs, price changes, or design updates all contaminate results.
- Don’t stop early because one version looks like it’s winning. Early data is almost always misleading, and the lead often flips as the sample grows.
- Don’t run the test during a promotional period unless your hypothesis is specifically about how visitors behave during those events.
Duration rule: Run for at least two full business cycles — typically two to four weeks — AND until you’ve reached your pre-calculated sample size. Both conditions need to be satisfied before you stop.
How to Read Shopify A/B Test Results Without Getting Misled?
This is where most merchants go wrong. The tool declares a winner, and the winning version gets implemented. What’s missing is understanding what the results are actually saying — and what they’re not.
What Statistical Significance Actually Means?
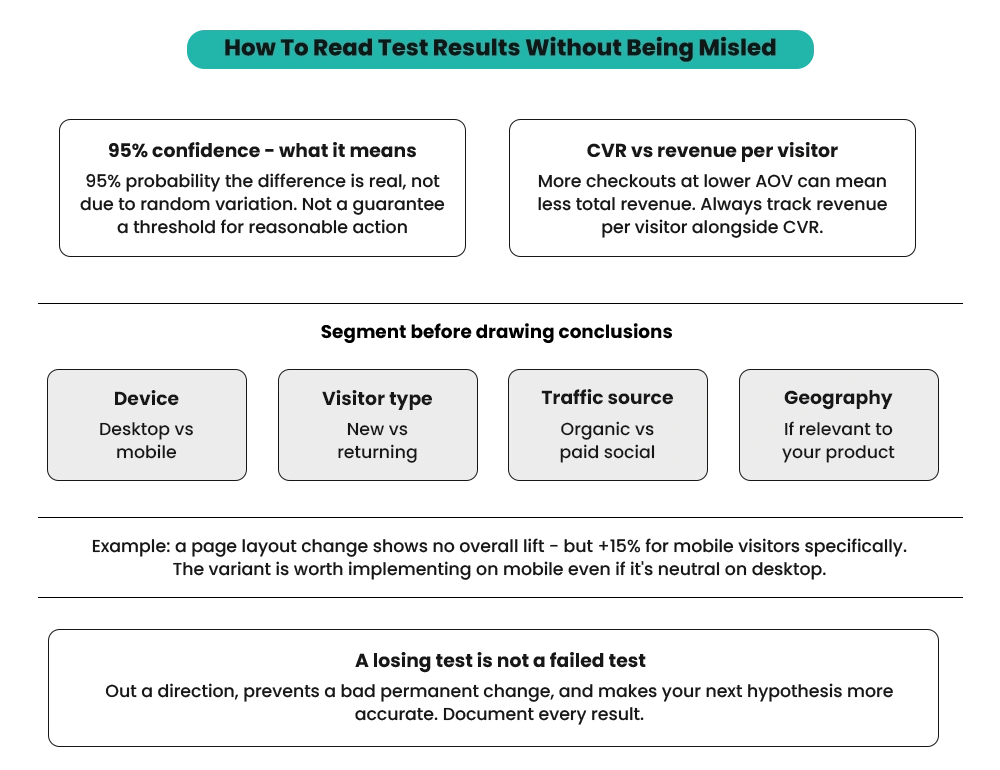
Most tools report results at 95% confidence, which means there’s a 95% probability the difference in performance is real — not due to random variation. It’s a threshold for reasonable confidence, not a guarantee.
Don’t confuse a small conversion rate difference with a large practical impact. A 3.1% versus 3.3% conversion rate looks like a win, but if revenue per visitor is the same or lower, it may not be worth implementing. The metric that matters most is revenue per visitor, not conversion rate in isolation.
Conversion Rate vs. Revenue Per Visitor
A variant that produces more completed checkouts at a lower average order value might actually generate less total revenue than the control. This distinction matters more than most merchants realize.
In one documented pricing test for an ecommerce wellness brand, raising the price on one product while lowering another lifted profit per visitor by 54.7% — while a 50% site-wide discount improved that figure by only 13.6%. Optimizing for conversion rate alone would have left significant revenue on the table.
Segment the Results Before Drawing Conclusions
A test that shows no overall winner might be hiding a significant result within a specific segment. Before dismissing an inconclusive test, check performance by: desktop versus mobile, new versus returning visitors, organic versus paid traffic, and geographic segment if relevant.
A product page layout change might show no overall conversion lift but a 15% improvement specifically for mobile visitors. That tells you the variant is worth implementing on mobile — even if it’s neutral or slightly weaker on desktop.
What a “Losing” Test Tells You
A variant that performs worse than the control isn’t a failure. It’s data. It rules out a direction you might otherwise have tested again in six months. Document the result: what you tested, what the hypothesis was, what the data showed, and what segment-level insights you found.
Over time, this record becomes a library of what your specific audience responds to — which makes every future hypothesis more informed and more likely to produce a meaningful result.
Shopify A/B Testing Mistakes That Quietly Waste Time and Budget
Running tests without enough traffic
A test on a page with 200 visitors per week will take months to reach statistical significance — and the results will still be questionable. If high-traffic pages aren’t available, A/B testing isn’t the right tool yet.
Stopping tests early
Seeing a version winning at day five and ending the test is one of the most common and costly mistakes. Conversion patterns shift across the week — weekday versus weekend behavior is often very different — and early sample data consistently overstate the magnitude of any apparent difference.
Testing too many things at once
Changing the headline, the button color, and the product image in the same test makes it impossible to know what caused the result. One change per test, every time.
Not accounting for the novelty effect
Visitors sometimes interact differently with something simply because it’s new — not because it’s better. For significant design changes, running the test for four or more weeks lets novelty fade and gives you a more accurate read on sustained performance.
Running tests during promotions
Discount periods, flash sales, and heavy email campaigns bring visitors with different intent. Results from these periods don’t reflect how the change performs under normal conditions and shouldn’t drive permanent decisions.
Not tracking revenue metrics
Optimizing for add-to-cart rate or click-through rate only matters if those gains translate to revenue. Always track revenue per visitor alongside your primary metric — or you risk improving a number that doesn’t move the business. Our post on how to set realistic Shopify sales goals that actually convert walks through how to frame revenue metrics as part of a broader growth strategy.
After the Test: What to Implement, What to Archive, and What to Test Next
- If the variant wins: implement it permanently, document the test thoroughly — hypothesis, methodology, results, segment performance — and design the next test on top of that learning.
- If the control wins or the test is inconclusive: don’t discard the data. Understand why the variant didn’t perform as expected. The learning often tells you more than a win because it rules out a direction and shifts the hypothesis for the next test.
- Build a test log from the start. Start it now — even a simple spreadsheet with hypothesis, test dates, results, and segment notes is enough to build from. After six to 12 months of structured testing, this archive tells you more about your customers than any analytics tool can. That knowledge compounds. Each test makes the next one more likely to succeed.
Where to Start with Shopify A/B Testing?
The order matters:
- Check whether your store has enough traffic to produce reliable results
- Identify a real conversion problem backed by data
- Form a specific, data-backed hypothesis
- Pick the right testing tool for the type of test you’re running
- Run the test for its full duration
- Read results with segmentation in mind before concluding
One well-structured test every four to six weeks produces more useful knowledge than ten poorly designed ones running simultaneously. Session recordings, funnel drop-off data, and heatmaps tend to surface the clearest testing priorities faster than any amount of guessing — so start there, before you pick a tool or design a test.
At Mastroke, CRO work starts with diagnosing where the store is losing conversions, forming the right hypotheses, and building a testing cadence that produces real evidence over time. Explore what our Shopify agency does to see how we approach this work end-to-end.
Ready to Scale with Smarter Shopify CRO?
Successful A/B testing is about more than changing button colors. Mastroke helps Shopify and Shopify Plus brands build conversion-focused growth strategies with experimentation, user experience improvements, and ongoing CRO programs designed for long-term performance.
Frequently Asked Questions-
Q: What is Shopify A/B testing?
A: Shopify A/B testing means showing two versions of a page, element, or offer to different visitors at the same time and measuring which one performs better against a defined metric — conversion rate, add-to-cart rate, or revenue per visitor. It’s the most direct way to make store decisions based on real visitor behavior instead of assumptions.
Q: Which is the best Shopify A/B testing app?
A: For theme-level testing without developer support, Shoplift is the most accessible Shopify-native option. For more advanced testing with heatmaps and revenue tracking, VWO integrates well with Shopify. For price and shipping fee testing specifically, Intelligems is purpose-built for that use case. The right choice depends on what you’re testing.
Q: How much traffic do I need to run a valid Shopify A/B test?
A: To detect a 10% improvement over a 3% baseline conversion rate, you need roughly 8,500 visitors per variation. To detect a 5% improvement, that jumps to over 38,000 visitors per variation. Stores with fewer than 30,000 monthly visitors should focus on qualitative research — heatmaps, session recordings, customer surveys — before investing in A/B testing infrastructure.
Q: How long should a Shopify A/B test run?
A: At a minimum, seven to 14 days. Ideally, two full business cycles — two to four weeks — and until you’ve reached your pre-calculated sample size. Both conditions need to be met. Ending a test early because one version looks like it’s winning is one of the most common causes of incorrect decisions.
Q: What should I test first on my Shopify store?
A: Start with the pages that have the most traffic and the clearest conversion problem. A product page where 60% of visitors leave without adding to cart is a higher priority than a homepage most direct buyers bypass. Use heatmap and session recording data to identify which specific elements to test rather than choosing changes based on intuition.
Q: Does a losing A/B test mean the idea was wrong?
A: No. A variant that performs worse than the control rules out a direction — which prevents you from testing the same thing again or making the wrong change permanently. Document every losing test with the hypothesis and segment-level data. That record becomes one of the most valuable things you can build for long-term CRO work.
Q: Can I run multiple A/B tests on Shopify at the same time?
A: You can, but only on different pages. Running two tests on the same page simultaneously means you can’t isolate what caused any result you see. Keep it to one test per page at a time, and make sure tests on different pages aren’t sharing enough of the same traffic to contaminate each other’s results.