This blog post explains how to properly evaluate Shopify conversion rates beyond just looking at raw numbers. It provides context-specific benchmarks and explains why the commonly cited "2-3% industry average" is misleading without considering traffic sources, products sold, and store maturity.
Most Shopify merchants check their conversion rate the same way they check their revenue — just the number, with no context for whether it’s good, bad, or somewhere in between.
A store converting at 1.8% isn’t necessarily underperforming. A store sitting at 3% isn’t necessarily in a healthy position. The number without context tells you almost nothing.
Here’s the problem: most merchants compare their rate to a vague “2–3% industry average” they found somewhere online — then either panic or feel fine without any real basis for either response. That number gets repeated everywhere, but almost no one explains what it actually accounts for or what shifts it.
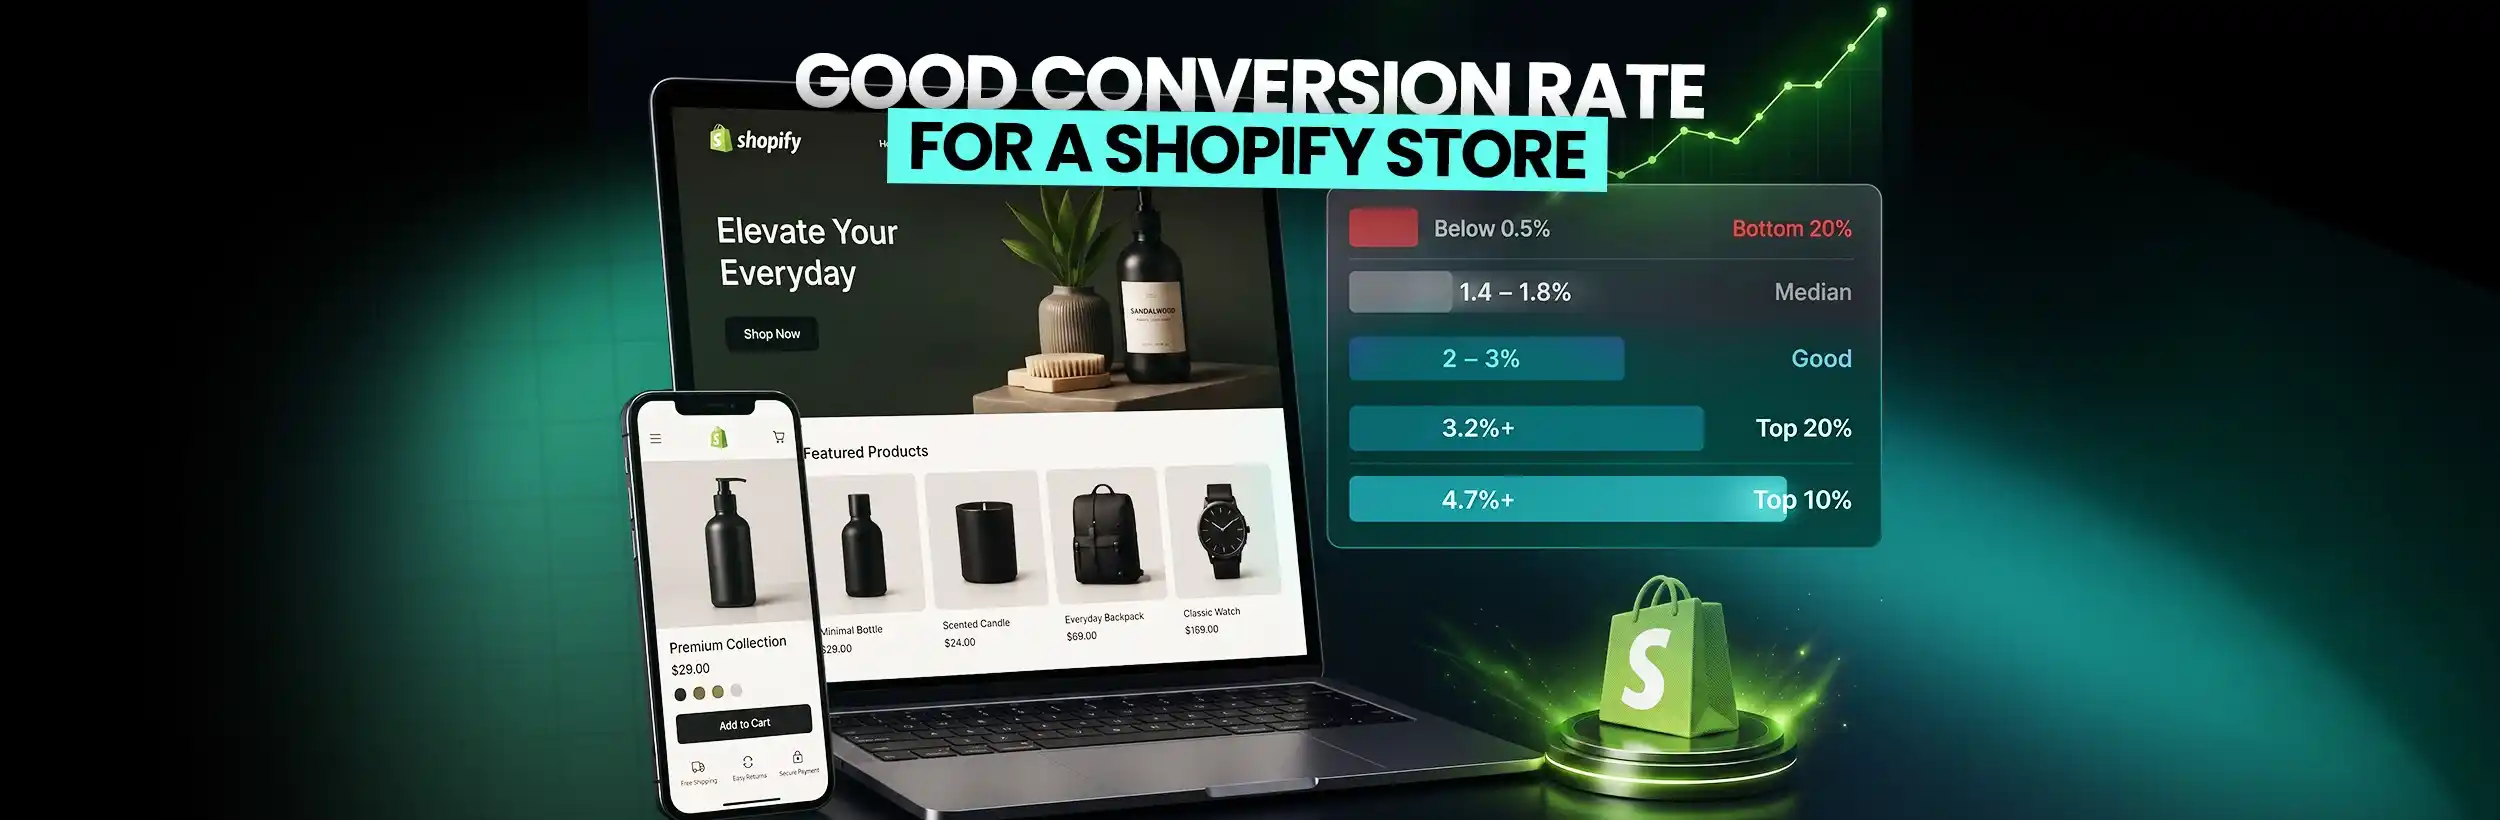
A good conversion rate for a Shopify store depends on where your traffic comes from, what you’re selling, what device your visitors are using, and what stage your store is at. This guide breaks down the actual benchmarks, explains what moves the number, and gives you a clear read on where your store actually stands.
What Is Conversion Rate — and How Does Shopify Measure It?
The Formula
The math is simple. Conversion rate = (Orders ÷ Sessions) × 100.
If your store gets 1,000 sessions in a month and 15 of those result in completed orders, your conversion rate is 1.5%. Shopify tracks this automatically inside Analytics — you don’t need to calculate it manually.
Sessions vs. Unique Users — Why It Matters?
Shopify uses sessions, not unique users, to calculate the rate. A returning customer who visits three times and completes a purchase on the third visit generates a 33% conversion rate across those visits — but that clearly doesn’t mean your store is converting at 33%.
This session-based method matches Google Analytics 4 and is the industry standard, but it does mean your reported rate can look different depending on how much return traffic your store receives. Stores with high repeat purchase rates and loyal customer bases may see slightly inflated rates compared to stores running entirely cold traffic.
What Counts as a “Conversion” on Shopify?
Shopify’s default tracks completed purchases only. Adding an item to the cart, creating an account, or signing up for email — none of those count in the standard conversion rate metric.
When comparing your number to any benchmark, make sure you’re measuring purchase completions, not broader funnel actions. And before you trust the number at all, you need at least 500 sessions over 30 days. Below that, a single slow week or a single good day can swing the rate by a full percentage point — and that’s not useful information.
What Is the Average Shopify Conversion Rate in 2026?
Platform-Wide Benchmarks
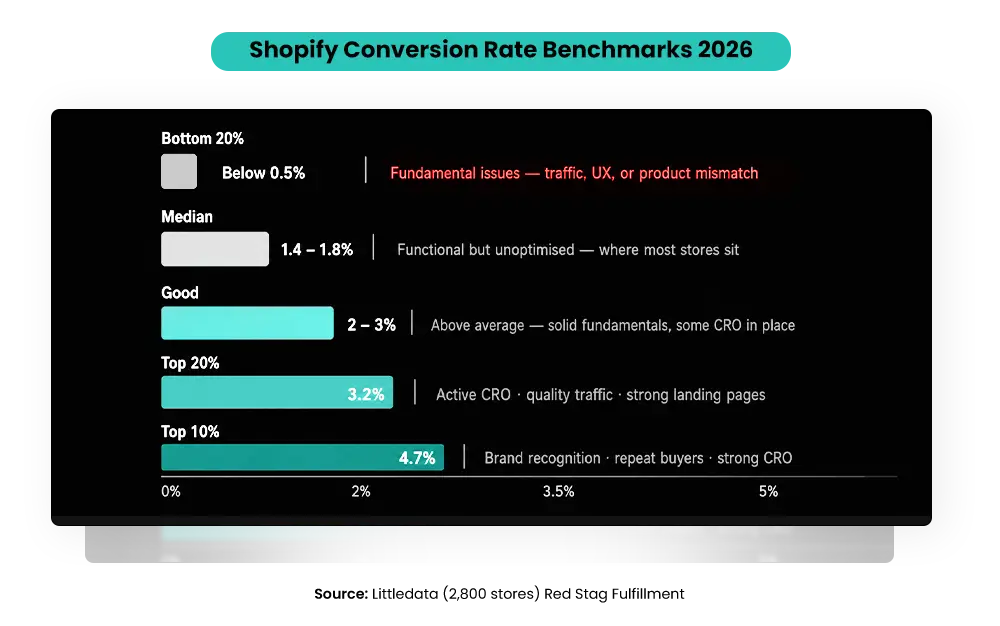
According to Littledata’s analysis of 2,800 Shopify stores, the average Shopify store converts at 1.4% of sessions into completed purchases. For context on where that sits:
- Bottom 20%: Below 0.5% — fewer than 1 in 200 visitors complete a purchase
- Average: 1.4% — functional but unoptimized
- Top 20% threshold: 3.2%
- Top 10% threshold: 4.7%
Shopify’s own published guidance confirms that stores converting above 3% are already “among the very best-converting online stores” (Shopify Blog, 2026). Reaching 4.7% or above places a store in the top 10% of all Shopify merchants globally, per Littledata’s benchmark data.
What Do These Numbers Actually Mean in Context?
Median doesn’t mean healthy. The 1.4% average includes stores with poor technical setups, mismatched traffic, and product pages that haven’t been touched since launch. It also includes stores that are actively growing.
A store at 1.8% with clean, high-intent organic traffic is in a completely different position from a store at 1.8% running broad paid social to cold audiences. The rate looks identical. The situation is not.
The number only makes sense alongside its traffic source, which the next section covers.
What Is a Good Conversion Rate for a Shopify Store in 2026?
Here’s the honest breakdown by tier:
| Tier | Conversion Rate | What It Usually Means |
| Bottom 20% | Below 0.5% | Fundamental issues: poor traffic, weak UX, or product-market mismatch |
| Average | 1.4% | Functional but unoptimized |
| Good | 2–3% | Above average — solid fundamentals, some CRO in place |
| Strong | 3.2%+ | Top 20% — active optimization, quality traffic, strong landing pages |
| Exceptional | 4.7%+ | Top 10% — combines brand recognition, repeat buyers, and strong CRO |
What “Good” Actually Looks Like at Different Stages?
For a new store under 6 months old with mixed traffic, 1–1.5% is realistic and not a problem. Expecting 3% from a store still building trust and accumulating reviews is setting the wrong target.
For a store with 6–18 months of data and mostly paid traffic, 1.5–2.5% is a reasonable goal to work toward. You have enough data to identify where the drop-off is happening.
For a store where organic search, email, and returning customers make up most of your traffic, 3%+ is genuinely achievable — because those sources come with significantly higher purchase intent than cold paid social.
The goal isn’t to hit a universal target. It’s to improve from where you are, with the traffic mix you actually have.
Why Your Conversion Rate Varies — The Factors That Shift the Number
Comparing your conversion rate to another merchant’s without accounting for these variables is like comparing your fuel efficiency to a truck driver’s. The context is too different.
Traffic Source Is the Biggest Variable
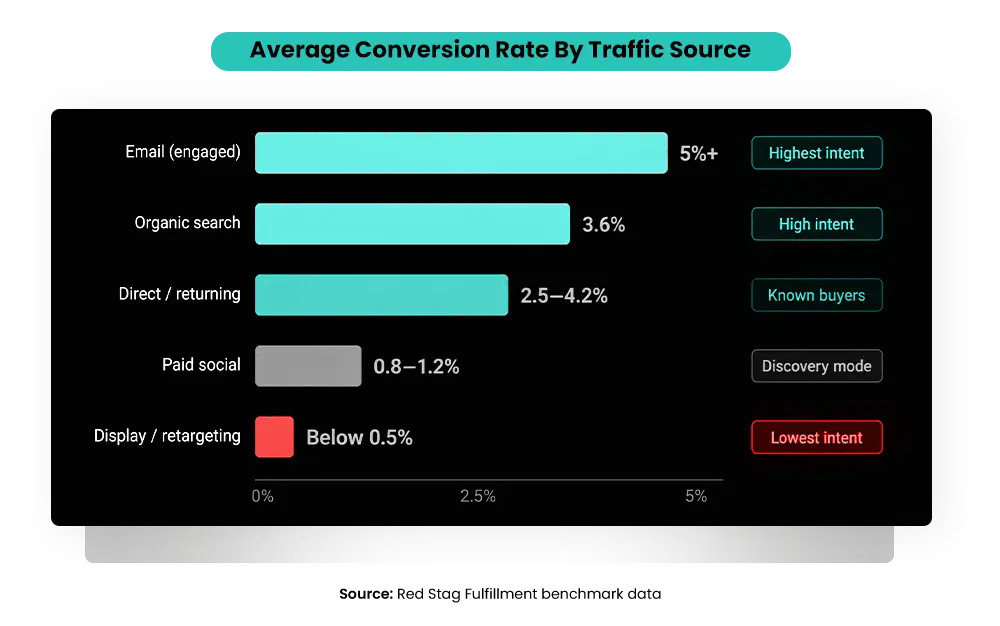
The same product page converts at completely different rates depending on where the visitor came from. Here’s how the channels break down, based on aggregated industry benchmark data across multiple sources, including Littledata and Shopify’s own published research:
- Email marketing (engaged subscribers): 4–5%+ — these visitors already know and trust the brand
- Organic search: 2.7–3.6% — high purchase intent already present before they arrive
- Direct traffic (returning customers, brand searches): 2.5–4%
- Paid social (Meta, TikTok): 0.7–1.2% — cold audience, discovery-mode browsing
- Display and retargeting: typically below 0.5%
- Practical read: a store running 80% paid social traffic at 1.1% isn’t underperforming — it’s performing exactly how paid social traffic performs.
Comparing that to a store built on organic search and email is a meaningless exercise.
Device Type Creates a Consistent Gap
Desktop converts at approximately 1.9% on average. Mobile converts at approximately 1.2% — a significant gap, even though mobile generates over 50% of total Shopify traffic, per Littledata’s benchmark data.
Stores with heavy mobile traffic and a poor mobile experience will show a lower conversion rate that isn’t a product problem — it’s a UX problem. Smaller tap targets, slow image loading, checkout that requires too many steps — any one of those alone is enough to drop the rate meaningfully.
Price Point Changes Everything
Low-ticket products priced $10–$50 typically convert at 2.5–4% — low-friction, impulse-friendly purchases. Mid-range products at $50–$200 tend to land near the platform average. High-ticket products above $500 often convert below 1% — and that’s not a failure, it’s a function of how long buyers take to research and justify higher-cost purchases.
A luxury goods store converting at 0.8% with an average order value of $600 is doing well. A fast-fashion store converting at 0.8% with a $35 AOV has a real problem.
Product Category Benchmarks
The category affects the baseline significantly. Beauty and personal care converts above 4% industry-wide — high emotional purchase intent and frequent repeat buying drive this. Fashion and apparel on Shopify sit at around 1.9%. Food and beverage around 1.5% — repeat purchase volume drives revenue here, not single-visit conversion. Electronics and tech typically fall below 1.5% — comparison shopping extends the decision cycle. Subscription products tend to reach 2.5–3.8% — the lower perceived risk of ongoing value lifts the initial conversion.
These figures are consistent across multiple industry sources, including Littledata’s category breakdowns and Shopify’s published benchmark content.
Conversion Rate Is One Number — Here’s What Else to Track Alongside It
A low conversion rate is a symptom. It doesn’t always tell you where the problem is. These three additional data points help you diagnose which part of the funnel is actually failing.
The Add-to-Cart to Purchase Ratio
For every 3 visitors who add something to the cart, at least 1 should complete the purchase. That’s the 3:1 ratio to target.
If the ratio is worse than 3:1, your checkout has friction. Too many form fields, forced account creation before purchase, unexpected shipping costs appearing at the final step, or limited payment options. The intent was there — the checkout lost it.
If the add-to-cart rate is low but your ratio between add-to-cart and purchase is fine, the problem is earlier in the funnel. Product page trust, price perception, or traffic quality are more likely culprits.
Reading CTR, Add-to-Cart, and Conversion Together
- High CTR on ads but low conversion: the ad creates interest, but the landing page doesn’t follow through. Price, shipping expectations, or trust elements are failing at the point of decision.
- High add-to-cart rate but low purchase completion: urgency is missing, checkout is broken, or the buyer found a better price somewhere else before completing.
- Good conversion rate but poor net profit on ad spend: the orders are happening, but the economics don’t work. Average order value is too low relative to what you’re spending to acquire each customer.
- All metrics are weak: this is almost always a message-market fit issue. The product isn’t connecting with the right audience — the problem starts before the product page.
When to Use Conversion Rate and When Not To?
Conversion rate is the right metric when you’re comparing traffic quality over time, evaluating A/B test outcomes, or assessing landing page performance.
It’s the wrong metric when you’re comparing performance across completely different product categories, measuring growth during a period of significant volume scaling, or trying to evaluate campaign ROI in isolation. Revenue per session and customer lifetime value tell a more complete story in those cases.
How to Find Your Shopify Conversion Rate Right Now?
This takes under two minutes.
- Step 1: Log in to Shopify Admin → Analytics → Reports → Behavior
- Step 2: Click “Online store conversion rate” → set the date range to at least 30 days
- Step 3: The metric shown is “Sessions that resulted in orders” ÷ “Total sessions” — this is your rate
- Step 4: Cross-reference with Google Analytics 4 ecommerce conversion rate to catch any tracking discrepancies from apps or pixel setup issues
If you have fewer than 500 sessions in the period, extend to 60–90 days. Data below 500 sessions swings too much to act on reliably.
What to look for once you’re in the data?
Is the rate consistent week over week, or swinging by full percentage points? Large swings usually mean small session volume — not real performance changes.
Is mobile conversion materially lower than desktop? It almost always is — but how large is the gap? More than 1 percentage point of difference is worth investigating as a UX problem, not a product problem.
Which traffic source has the highest and lowest rate? That tells you exactly where your traffic quality problems are — and which channel to invest more in or stop sending budget to.
What’s Pulling Your Conversion Rate Down?
These are the most common causes of underperformance — and the most frequently misdiagnosed ones.
Poor Mobile Experience
Over 50% of Shopify traffic comes from mobile, but mobile converts 58% lower than desktop on average. Small tap targets, slow image loading, horizontal scroll on product pages, a checkout that requires too many steps — any one of these kills mobile conversion quietly and consistently.
The fix requires testing on a real phone, not a browser emulator. Browser emulators don’t show you what a real user experiences on a 4G connection. If you want to see how small mobile experience mistakes quietly reduce conversions on Shopify stores, this quick breakdown explains it clearly:
>
>
For a detailed walkthrough of what to look for across your store’s entire performance profile, read our guide on Shopify performance optimization and where fast stores still lose sales.
Checkout Friction
Forced account creation before purchase. Unexpected shipping costs appear at the final step when the visitor is already mentally committed. Too many form fields. No Shop Pay, Apple Pay, or buy-now-pay-later options for orders above $100.
Each of these creates a moment of hesitation right before the purchase. Remove them one at a time and measure the impact.
Weak Trust Signals on Product Pages
The Spiegel Research Center at Northwestern University studied the impact of reviews on purchase behavior across thousands of products and found that displaying just 5 reviews on a product page increases purchase likelihood by 270% compared to a page with no reviews. The first five reviews have the biggest impact — the marginal benefit of additional reviews diminishes quickly after that point.
Trust isn’t a nice-to-have on a product page — it’s what tips undecided buyers into completing the purchase. Missing or hard-to-find return policies, no security badge near the checkout button, no visible contact information, generic descriptions that don’t answer the buyer’s actual questions — these small gaps add up into a conversion rate that consistently underperforms.
Mismatched Traffic and Product
If 90% of your sessions are from cold Meta or TikTok traffic and your conversion rate is 1%, that’s not a store problem. That’s a natural consequence of running discovery-mode traffic to a product requiring more consideration before buying.
The traffic source has to match where the buyer is in their decision process. Cold paid social brings visitors who are browsing. Organic search brings visitors who are looking for what you sell. Those two groups convert at completely different rates — and treating them the same is where a lot of budget gets wasted.
Page Speed
A one-second delay in page load time can reduce conversions by up to 7% — a figure consistently cited across industry research and confirmed by Google’s own Core Web Vitals data (Shopify Blog on page speed and conversion). Most Shopify stores score lower on mobile PageSpeed than merchants expect — especially stores with multiple third-party apps loading scripts on every page. Uncompressed product images are the single most common and most fixable cause.
For a specific action plan on improving Shopify speed, read our guide on 10 ways to improve Shopify Plus speed optimization.
Getting Traffic But Your Shopify Store Still Isn't Converting?
How to Improve Your Conversion Rate — What Actually Moves the Number
Fix Checkout Friction First
Enable Shop Pay, Apple Pay, and Google Pay. Allow guest checkout without forcing account creation. Show shipping costs early — on the product page or in the cart, not at the final step. Cut form fields to the minimum required to process the order.
These are the highest-leverage fixes in the entire CRO playbook. Every unnecessary step between “add to cart” and “order confirmed” is a moment where someone can leave — and many do.
Strengthen Product Page Trust
Add star ratings above the fold — not buried at the bottom of the page. Include a return policy summary directly on the product page, not just in the footer. Add a security badge near the “Add to Cart” button. Use product photos that show the item in actual use, not just on a white background. And prioritize getting those first five reviews — the research shows that’s where the conversion impact is largest.
Improve Mobile Experience
Make CTA buttons large enough to tap without zooming. Compress images and defer non-essential app scripts to reduce page weight on mobile. Simplify navigation — fewer clicks to reach the product, fewer steps to check out. The goal is to remove any moment where a mobile user has to think about what to do next. If a step causes any hesitation on mobile, it’s costing you conversions.
Fix Page Speed
Compress all product images to WebP format. Run an app audit — every unused app that hasn’t been removed is still loading scripts on your pages, slowing load time for every visitor. Target under 2 seconds on desktop and under 3 seconds on mobile. Use Shopify’s built-in CDN correctly and defer non-critical JavaScript.
Speed is a direct revenue lever. Faster pages reduce bounce rates, build trust, and give your product page a better chance of converting the traffic you already paid to acquire.
Add Urgency That’s Actually Real
Stock scarcity callouts when inventory is genuinely low. Clear shipping cutoff times for next-day or weekend delivery. A limited-time offer on the product page itself, not just in a pop-up that closes instantly.
These signals work because they reflect real conditions. Manufactured urgency — fake countdown timers, stock numbers that never change — gets noticed and kills trust. Real urgency converts. Fake urgency doesn’t and creates a credibility problem that’s hard to recover from.
Use Exit-Intent Offers for First-Time Visitors
A 10–15% first-order discount is shown after 30+ seconds on the page — not the moment someone arrives. A free shipping threshold reminder for visitors about to leave with items in their cart. These aren’t tricks; they’re relevant offers shown to visitors who have already demonstrated interest.
Realistic Targets — What to Aim for in Your First 90 Days of CRO Work
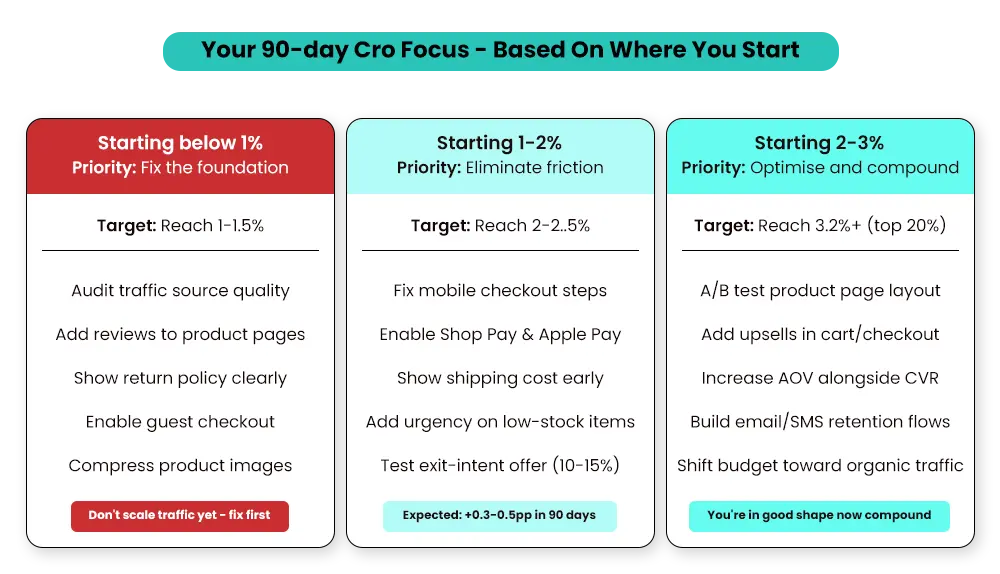
- Starting below 1%: Traffic quality and basic trust signals come first. The priority is reaching 1–1.5% before worrying about advanced optimization. That means evaluating where your traffic is coming from and whether your product page answers the buyer’s core questions.
- At 1–2%: This is where most merchants are, and the fixes here are specific. Checkout friction, mobile UX, and product page trust signals are where the revenue is hiding. A realistic 90-day target for a store in this range is 0.3–0.5 percentage points of improvement, which sounds small but translates directly into meaningful revenue at any volume.
- At 2–3%: You’re in reasonable shape. The work here shifts to A/B testing value propositions, expanding payment options, and working on average order value alongside conversion rate. The target is moving toward 3.2%, which puts you in the top 20% of all Shopify stores.
- Above 3.2%: Focus shifts to protecting what’s working while testing incremental improvements. One thing worth knowing at this stage: conversion rate optimization sometimes trades with AOV. Removing friction can bring in more lower-value orders. Track both numbers together.
The truth: moving from 1% to 2% is easier than moving from 3% to 4%. The highest-converting stores combine product-market fit, brand trust built over time, and a checkout that removes every possible reason to leave. There’s no shortcut for the first two — but the checkout and UX work is controllable and immediate.
For a full diagnostic framework to identify exactly where your store is leaking revenue, read our Shopify CRO audit guide.
How Mastroke Helps Shopify Merchants Improve Conversion Rate?
Most conversion rate problems aren’t visible in the conversion rate number itself. They’re in the checkout funnel, the product page trust architecture, the mobile experience, or the mismatch between traffic source and landing page.
A common pattern: a merchant with 70% mobile traffic, a 0.9% overall conversion rate, and a desktop rate nearly double that. The conversion rate number looks like a product problem. The actual problem is a mobile UX issue — buttons too small, images loading slowly on 4G, a checkout with five steps where three would do. The fix is in the experience, not the product.
Merchants often fix the wrong thing first. They adjust pricing when the real issue is checkout friction. And they redesign the homepage when the real issue is mobile page speed. They run more traffic when the real issue is that the traffic they already have isn’t converting.
At Mastroke, conversion rate work starts with diagnosing what’s actually happening at each stage of the funnel — not with a generic checklist applied to every store equally. Every Shopify store is at a different stage, with different traffic sources, different price points, and different checkout setups. The fix has to match the actual situation.
Conclusion
A good conversion rate isn’t one number. It’s the number that makes sense for your traffic mix, your product category, your price point, and your current stage of growth.
If you’re below 1%, traffic quality and trust signals are the priority — get there before worrying about advanced CRO. When you’re at 1–2%, checkout friction and mobile UX are where the revenue is hiding. If you’re at 2–3%, you’re in reasonable shape — focus on incremental improvements and work on average order value alongside conversion rate.
Start with the data you have. Find the weakest point in your funnel. Fix it. Then look again.
Ready to Scale a Shopify Store That Converts Better?
Frequently Asked Questions About Good Conversion Rate-
Q: What is a good conversion rate for a Shopify store in 2026?
A: For most Shopify stores, 2–3% is a good conversion rate. The top 20% of stores convert above 3.2%; the top 10% above 4.7%, per Littledata’s benchmark analysis of 2,800 Shopify stores. The platform-wide average is 1.4%, but what counts as “good” depends on your traffic source, price point, and product category.
Q: Is a 1% conversion rate bad for Shopify?
A: Not necessarily. If most of your traffic comes from cold paid social ads, 1% is close to what that channel typically delivers. If you’re running primarily organic search or email traffic and sitting at 1%, that’s below where you should be. Context matters more than the number alone — always read your rate alongside your traffic source breakdown.
Q: How do I find my conversion rate in Shopify?
A: Go to Shopify Admin → Analytics → Reports → Behavior → Online Store Conversion Rate. Set a date range of at least 30 days. You need at least 500 sessions in the period for the number to be statistically meaningful — below that, extend to 60–90 days.
Q: What causes a low Shopify conversion rate?
A: The most common causes are poor mobile experience, checkout friction (forced account creation, hidden shipping costs, limited payment options), weak trust signals on product pages, slow page speed, and a mismatch between the intent of your traffic source and what your product page delivers. Most of these are diagnosable in under an hour with the right data.
Q: Does product price affect conversion rate?
A: Yes, significantly. Products priced $10–$50 typically convert at 2.5–4%. Mid-range products at $50–$200 tend to land near the platform average. High-ticket products above $500 often convert below 1% — and that’s normal for categories requiring longer decision cycles, not a sign that something is broken.